.NET Logging in the microservices world


In this article I’ll take a deep dive into logging in the world of Microservices. Logging is one of the central aspects in a Microservices application. Through logging you understand how the application is behaving, which service is causing the others to go down, and what caused a specific error in one of the services. So in the next paragraphs, I’ll go through the lifecycle of adding logging to a microservices application. Starting with the simple solutions, to facing the real-world challenges.
Getting started with a .NET library for logging

This usually is the first thing that comes to your mind. Let’s get NLog or Serilog to do all the logging especially with all the different targets they support. They must be a future proof solution that will nail any situation we may encounter. But logging is one of the aspects that needs to be present in all services. And Microservices architecture encourage the use of multiple technologies in different services. For example, even if most of your development teams are using .NET or Node.JS, you probably will end up having a different technology in the mix. Like when you need to incorporate AI or Machine Learning which usually gets built using Python, or when you use one of the open source components/containers being NGINX, Istio or even Kubernetes itself, those being built using C++ or Go. Bottom line is that you will end up having a mix of technologies that need to have unified logging in order to debug what’s going on between these different services. So getting a unified .NET library across your teams will only work for half of the problem.
Keep it simple stupid (only log to Console)

That’s why when we are in the microservices world, it’s always recommended that you keep the real logging work out of the service code. The recommended approach is to always log to the standard output; this is the only thing that is unified across technologies and that can be easily read from the outside world assuming everything runs in a container. This means that an outside entity could read the STDOUT of all services (in the same fashion) and now we can control where do we want to put those logs. You may even drop the fancy nuget package you got in the previous solution and just use the default .NET Core logging extensions which logs to Console.
ELK or Elastic Stack

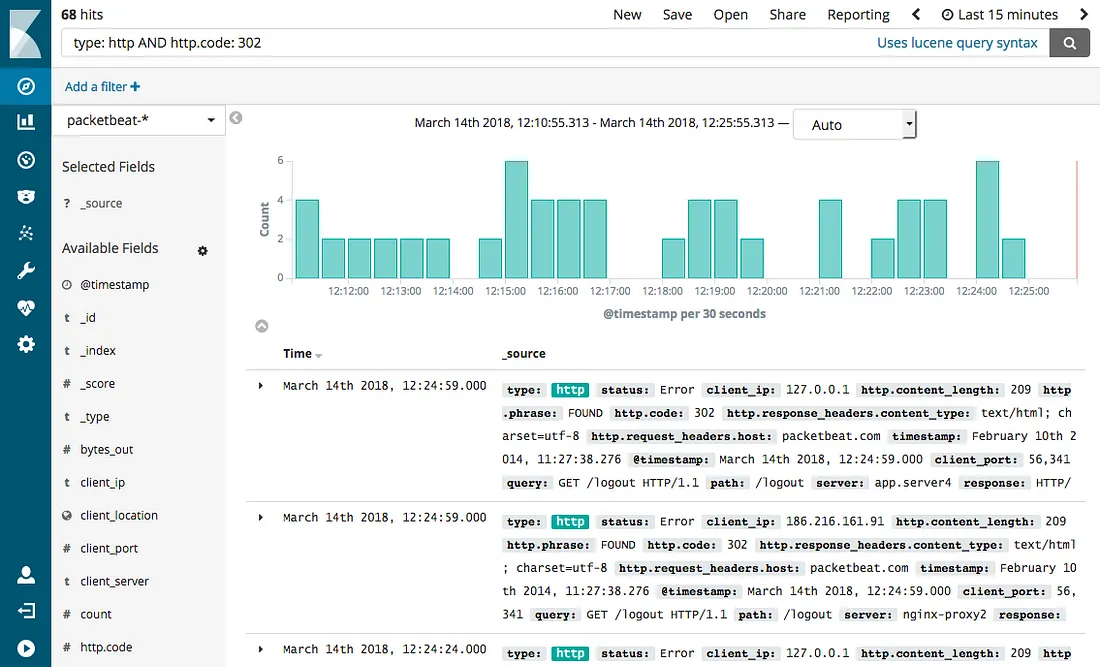
Then comes the need to aggregate these logs into a central location, and being able to monitor, search and diagnose problems in these logs. The next step is to add the ELK framework, which stands for Elastic Search, LogStash, Kibana. Elastic Search is a NoSQL database that is capable of taking all logs, index them and making them searchable. LogStash is a log collector and also a known format for storing such logs in a structured JSON format. And Kibana is a UI that can connect to Elastic Search and provide a usable interface for searching logs, making queries, and making dashboards and charts out of those queries. This stack is especially easy to handle in a containerized environment for 2 reasons:
- There are readymade containers for ElasticSearch and Kibana, along with Helm charts for deploying them to Kubernetes with minimum configurations. So deploying such a stack is not that big hassle.
- Docker default logging mechanism allow all container logs (STDOUT) to be stored/exposed into one directory in the host machine, so with a simple container like FluentD it’s easily configured to read all container logs and dump them into ElasticSearch with LogStash format. Which is effectively providing the functionality that we would have searched for in the previous logging frameworks, but this one does it regardless of the service technology.
 This approach works anywhere, in any environment, with any technology, but with the following drawbacks:
- It’s a bit hard to learn how to query logs in Kibana and how to make an effective dashboard that allow you to visualize the traffic, the errors, and easily diagnose the root cause of a problem. It can be done, but will need time and effort to master it.
- Logs gets very expensive which I will elaborate later below.
Application Insights
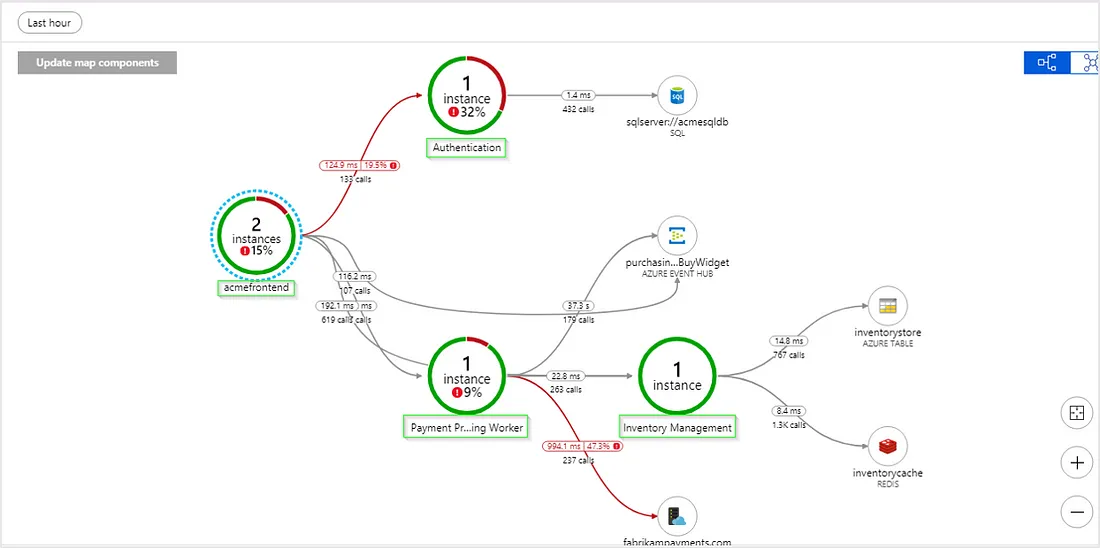
Another solution that makes sense for .NET developers is Application Insights. It fully supports .NET among some other technologies. It’s based on Microsoft Azure Cloud. It’s very easy to turn on, as opposed to the above ELK solution. And you don’t have to host your solution in Azure (just your logs will get shipped to there from wherever you are hosting). The real advantage of this solution (there may be similar alternatives that are similar proprietary cloud-based services) is that you get a fully working dashboards, real time metrics, performance diagnostics and intelligent alerts. So, the time to market with much less hassle and quick learning curve is the real deal. I really recommend this approach for development and testing environments. So this fixes the first problem above. But it has the same second issue, which is it gets expensive to log so many data in production. Expensive in terms of price, as they will give you 1st GB per month for free (which is easily reached when multiple users are just testing your product in testing environment) and then you pay for each extra GB you use. And expensive in terms of getting slower to send these logs to Azure. In certain situations, on testing environment, I had to wait for 10 minutes for the logs to populate after testing. So it’s a good solution in the beginning but doesn’t scale well in real production.
The cost of Logging
Now to get more insights into the cost problem. Consider a scenario where we are calling 1 REST API in a service that does 1 database operation. Let’s imaging how many logs we would normally incur if we want these logs to be useful.
- Log the incoming request details
- Log that authorization header (token) have been checked for correct signature
- Log the MVC Controller/Action that is going to start executing to handle this request
- Log the operation we are about to make on database (with the SQL statement for example)
- Log the result of the database operation
- Log that the action has completed successfully and took how many milliseconds
See how many logs we are adding (for example 7 elastic search inserts) for 1 DB select statement? Now consider how many more would we need to log if our service had to make a call to another service to get data or make a transaction. Or even if our service sends an event to service bus that gets handled in multiple other services. You will end up having many more logs for a single user action. Which means that in order to keep all these logs you will need much more storage, processing and network bandwidth than your production application needs.
Possible solutions
Then comes possible solutions, which start by minimizing the number of logs in production. For example:
- Only log warning and errors in production, and don’t log trace, debug, nor information (assuming we only need to know if there is a problem, but how will we know what happen to lead to the problem?)
- Sample the logs, like select a random percentage of requests to be logged (like 5%) and log everything for these requests and ignore the rest. Application Insights supports this sampling mechanism. Which works fine if the problem is catastrophic that is causing all requests to fail. But what if the issue is related to a specific customer or a scenario that didn’t have the chance to appear in these random samples?
- Take all logs but don’t keep them for long (to save space), like delete all none error logs after 30 minutes. This will save space but not processing nor bandwidth. And will also miss important info once passed the time threshold.
- Other solutions consider only logging errors like first suggestion, but when something wrong happen, flip a configuration switch that will let all services start logging everything and incurring all the cost only in bad situations. But this approach also needs the configuration switch to happen without restarting the services (which add complexity to service configurations) and will also miss important logs.
And the list of solutions goes on and on with no silver bullet solution that takes care of everything.
One more possible idea
One idea that comes to my mind that I tried to implement myself in this project: CoreX.Extensions.Logging
Which to only collect logs when we ask about them, so by default ignore all logs and don’t collect them, but when the user makes a specific query (may be all logs, or logs by a specific user, or warnings only, or logs related to specific aspect like database or http) these are the only logs that needs to get sent on the wire for a central service. This fixes the cost of always logging everything, so it gets better performance as if we’re not logging anything. But when something wrong happens we are able to query this specific scenario/user/service…etc. Of course, this only works when troubleshooting a specific failing scenario to initiate this query before doing the scenario. Which means it will not work for troubleshooting previously logged errors.
So I’m not saying this is a better solution, but it just one more idea that can be mixed with the above solutions to handle specific needs.
Conclusion
I hope this deep dive make you take an early decision to unify logs using one or more of the discussed solutions.